Technology (SWM)
Shear Wave Measurement (SWM) technology uses the ARFI principle with a convex transducer for examination of the stiffness of the liver. It enables quantitative evaluation of shear wave velocity and adds a reliability indicator to each measurement, giving a rating of the appropriateness of the measurement.
Shear Wave Measurement uses an ARFI (the push pulse) to generate shear waves in a small region of interest (ROI) in the liver followed by longitudinal ultrasound tracking pulses that measure the speed of propagation of these shear waves. The SWM transmit/receive sequence is shown in (Fig. 1).
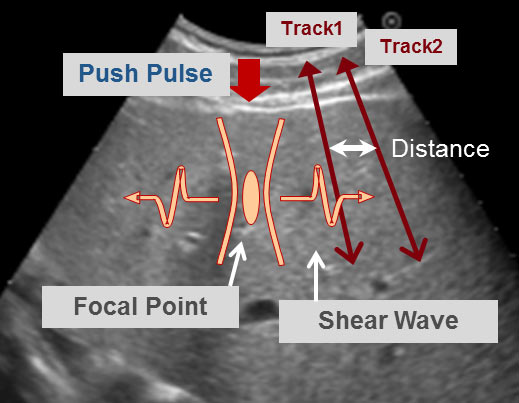
- Acoustic Radiation Force “Push Pulse” induces displacement of tissue at the focal point
- Transmission is stopped
- Shear Wave is generated at the edge of ARF and propagates off-axis
- Propagation speed calculated from detected time of arrival by tracking pulses
For each ‘push-track’ sequence, the shear wave velocity (Vs) is measured at multiple depths in the ROI and the sequence is automatically repeated so the propagation speed is measured several times in a short period. This is followed by a probe cooling time when all wave transmission is stopped. SWM conforms to the normal regulations applicable to diagnostic ultrasound systems relating to power output measurements and probe surface heating.
Reliability Indicator, VsN
It is common to display just one median value of Vs for the data measured inside the ROI in point shear wave speed measurement methods. However, it can be difficult to judge whether the measurement is appropriate or not from the Vs value alone. Disturbances can result from body motion, respiratory movement of the patient, unsteady handling of the transducer by the examiner, etc. In addition, the movement of the microvasculature due to cardiac motion or vascular flow can make echo signals fluctuate over time in the parenchyma of the liver. Even when the standard deviation is displayed, it can be difficult to distinguish if the variation is due to tissue structure or caused by measurement error. The SWM technique is designed to detect phase fluctuations caused by blood flow and micro-vibrations to overcome this problem, and as a result, the shear wave velocity, Vs, can be calculated with high accuracy.
The reliability indicator is calculated for each set of Vs values acquired from the multiple Push-Track sequences and multiple Vs measurements made at different depths inside the ROI for each measurement sequence. Values are rejected from the Vs set using three defined criteria, and the ratio of the remaining Vs values (Vs after rejection /total number of Vs) is defined as Vs efficacy rate, and displayed as a percentage, the VsN value. Median Vs and interquartile range (IQR) are calculated from the histogram of each Vs set after rejection (Fig. 2).
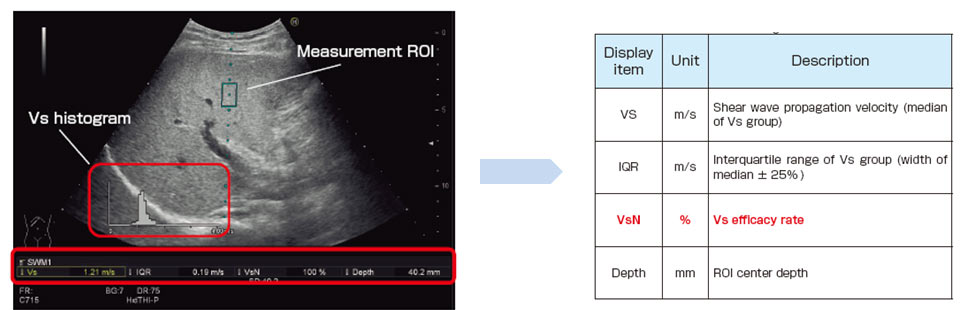
Fig. 2 The region of interest and the histogram are displayed. Chart of displayed values.
The three rejection conditions are illustrated in Fig 3.:
- Vs less than or equal to zero (1). Vs takes a negative value when the peak of track 2 is detected at an earlier time than the peak of track 1 due to, for example, disturbed shear waves. Shear waves in this case are not correctly detected and thus the value is rejected
- Outside a certain defined range of Vs (2). A certain range of Vs values are defined depending on the organs and tissues being examined. If Vs values are beyond that range, the value is regarded as a detection error of the shear wave speed and rejected
- When phase fluctuations are observed at a particular depth (3). phase fluctuations due to blood vessel and blood flow are different from shear waves and rejected as a detection error
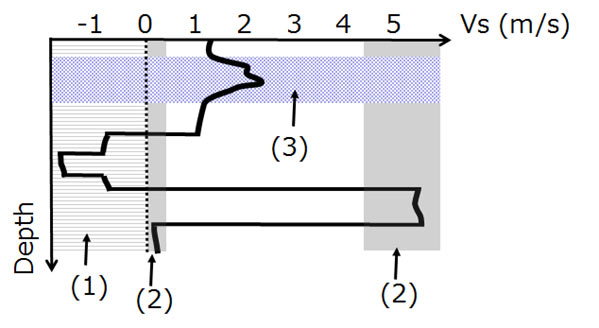
Fig 3. Illustration of the three rejection conditions