SIR Map
Colour images for carotid plaque analysis
Investigate plaque morphology for cardiovascular risk assessment and therapy
Our unique SIR Map technology depicts hemorrhagic, lipid or fibrotic tissue characteristics of a lesion in an easy-to-read colour map. And because it’s based on RADAR motion artefact technology for T1-weighted Spin Echo sequences, the results are barely influenced by patient movements like heartbeat or blood flow.
You’ll benefit from:
- Non-invasive, non-gated, uncomplicated & fast examinations.
- Objective and reliable results, independent of both patient and technical requirements.
- Qualitative and quantitative data for analysis.
- A colour map of plaque’s morphology for targeted treatment decisions.
- Therapy monitoring for carotid plaque response.
Gain valuable insights into plaque components for a fast, confident decision about treatment - and non-invasive monitoring of the disease.
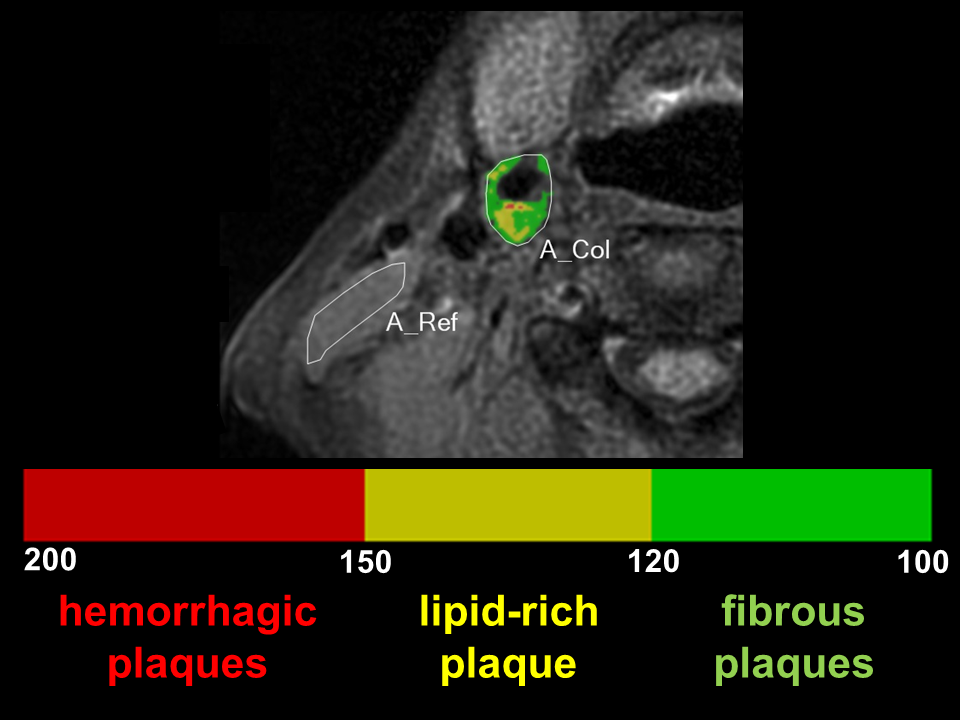
Differentiate between normal and affected tissue using a colour map
Now you can benefit from a colour map of the Signal Intensity Ratio (SIR) by normalising the ROI signal strength to a reference point in the muscle. The different colours depict various plaque characteristics: hemorrhagic, lipid or fibrotic – enabling you to make better-informed treatment decisions.

True T1 contrast scans with set TR and reduced flow artefacts
T1 contrast often weakens by the black blood method with double IR which is commonly used with biological signal gating. This non-gated RADAR-SE technique maintains a constant and short TR without influence from pulsation; and it enables imaging with a high T1 contrast that identifies plaque morphology. For example, a low signal indicates calcification; a middle one fibre or fat; and a high one bleeding.